Designing Large-Scale Developer Surveys: Lessons from the State of the CLI

Surveys like JetBrains' State of Developer Ecosystem and Stack Overflow's Annual Developer Survey provide invaluable insights into developers' tools, workflows, and pain points. But organizing these large-scale research initiatives takes thoughtful design and coordination.
This year, we conducted our first State of the CLI survey to uncover terminal usage patterns among developers. Through months of preparation, promotion, and analysis, we learned key principles for creating effective developer surveys. In this post, we'll share our methodology, findings, and advice to empower others to design high-quality surveys as well.
By open-sourcing our methodology in this guide, we hope to enable anyone to conduct impactful developer surveys. The insights from well-designed surveys can steer product development, documentation, and community engagement. We'll cover actionable tips on formatting questions, minimizing bias, reaching respondents, and more. Let's dive into the methods and lessons behind the State of the CLI 2023 survey.
Background and Motivation
This inaugural survey aims to be the first to gather and thoughtfully interpret data on terminal use among the wider developer community. Inspired by our own curiosities and echoed pain points from the community, we ventured into this research experiment with a focus on:
- The most favored terminals across Mac, Windows, and Linux.
- Understanding the essence of terminal interactions, considering usage frequency and specific applications.
- Popular terminal, command line interface (CLI), and shell tools within the developer community.
- Pinpointing the prevalent challenges and pain points.
We decided to focus on the CLI space, recognizing a distinct lack of discoverability with the tools and workflows in this ecosystem. Our team has always been intrigued by how developers tailor their terminals, prompts, shells, and everything in between to the way they want to work. Time and time again, we’ve observed developers inquiring about these tools in different communities.
Despite the demand, many of these tools, usage patterns, and insights remain under the radar due to the absence of a centralized report. Discovery is often left to chance encounters or word of mouth. And thus, this survey was born. If you haven’t checked that out yet, we recommend reading that first before this methodology!
Survey Design & Methodology
In approaching our survey, we held several key principles:
- Directional Headlines & Core Hypotheses: Start with the key insights we want to share and reverse-engineer our approach from there. We thought of this as “what headlines could we create with these questions?”
- Ease and Accessibility: We designed each question and the structure of the overall survey to emphasize simplicity to garner high participation.
- No Forced Questions: Instead of requiring respondents to answer every question, we made each question optional. This allows us to also use the response rate for each question as an indicator of their effectiveness or relevance.
- Bare Minimum Demographic Questions: We focused on collecting only the most essential background data from respondents, avoiding any unnecessary or intrusive personal information.
- Question Precision: Every question was meticulously crafted to be clear, logical, and unambiguous.
Directional Headlines & Core Hypotheses
Our survey was anchored around pivotal hypotheses we sought to validate. Here are a few examples:
- The CLI should be an intuitive tool for developers of all levels and proficiencies, not just experienced developers.
- Many of the existing and legacy terminals, shells, and CLIs fall short in discoverability and user-friendliness.
- Backend developers, system administrators, and DevOps professionals are the primary and most intricate users of the terminal.
We also took a light-hearted approach to some other questions, opting to include a ‘fun’ question: "Just for fun, what’s your favorite CLI command?" We expected developers would have a range of quirky, useful, or playful preferences to share. And our intuition was confirmed, as this question received an overwhelming response rate of nearly 90%.
Answers varied from standard git commands to popular apps like thefuck and jq. One response caught our eye - an encrypted message that decrypted to "I love Warp!"
echo -e "$(echo '73 32 108 111 118 101 32 87 97 114 112 33' | awk '{for(i=1;i<=NF;i++) printf "%c",$i}')"A frequent cheeky response was 'sudo rm -rf\'. This command appeared 32 times.
Ease and Accessibility
To optimize for broad reach and response rate, we structured our survey with the respondent’s experience in mind. We placed a robust emphasis on reducing friction and lightening the respondent’s cognitive load, so they could finish this survey quickly, while still providing us with meaningful data.
Here were a couple of heuristics that we followed:
Question Difficulty and Progression
Our approach mirrored that of a casual conversation: starting with light, straightforward inquiries and progressively moving into more intricate, involved questions. Recognizing that respondents might be susceptible to fatigue and distraction as they proceed, we positioned the most complex and potentially contentious questions in the middle of the survey.
For context, our survey started off with:
- What is your primary operating system for development?
- What is your primary device for development?
- And other quick single-select questions.
As the survey advanced, we transitioned into detailed inquiries on terminal usage and patterns, culminating in multi-select or matrix questions with many options, such as:
- What are the primary tasks for which you use the CLI?
- Which of the following CLI apps do you regularly use? (this one boasted over 40 options).
Moreover, we generally limited each page to 3-4 questions. Particularly taxing questions would be the only question on that page, or accompanied with questions that required less cognitive effort. An example of this is the 4th page on our survey:
“When learning about the terminal and CLI, how useful do you find the following resources?”
Conclusively, demographic details like areas of development focus, job titles, geographical regions, and industry specifics rounded off our survey.
Question Types
Our emphasis was on minimizing open-ended questions, reserving detailed inquiries for potential user interviews (from respondents who opted into leaving their email address with us).
Recognizing the time constraints of respondents, we primarily leaned towards single-select questions, striving to circumvent multi-selects and matrices wherever feasible. Admittedly, there were instances where adherence wasn't tenable, which we discuss in our improvements section.
Cognitive Bias
Mindful of cognitive biases, where early responses or viewed options might shape subsequent answers, we ensured questions susceptible to such influences occupied the survey's first half.
Survey Transparency
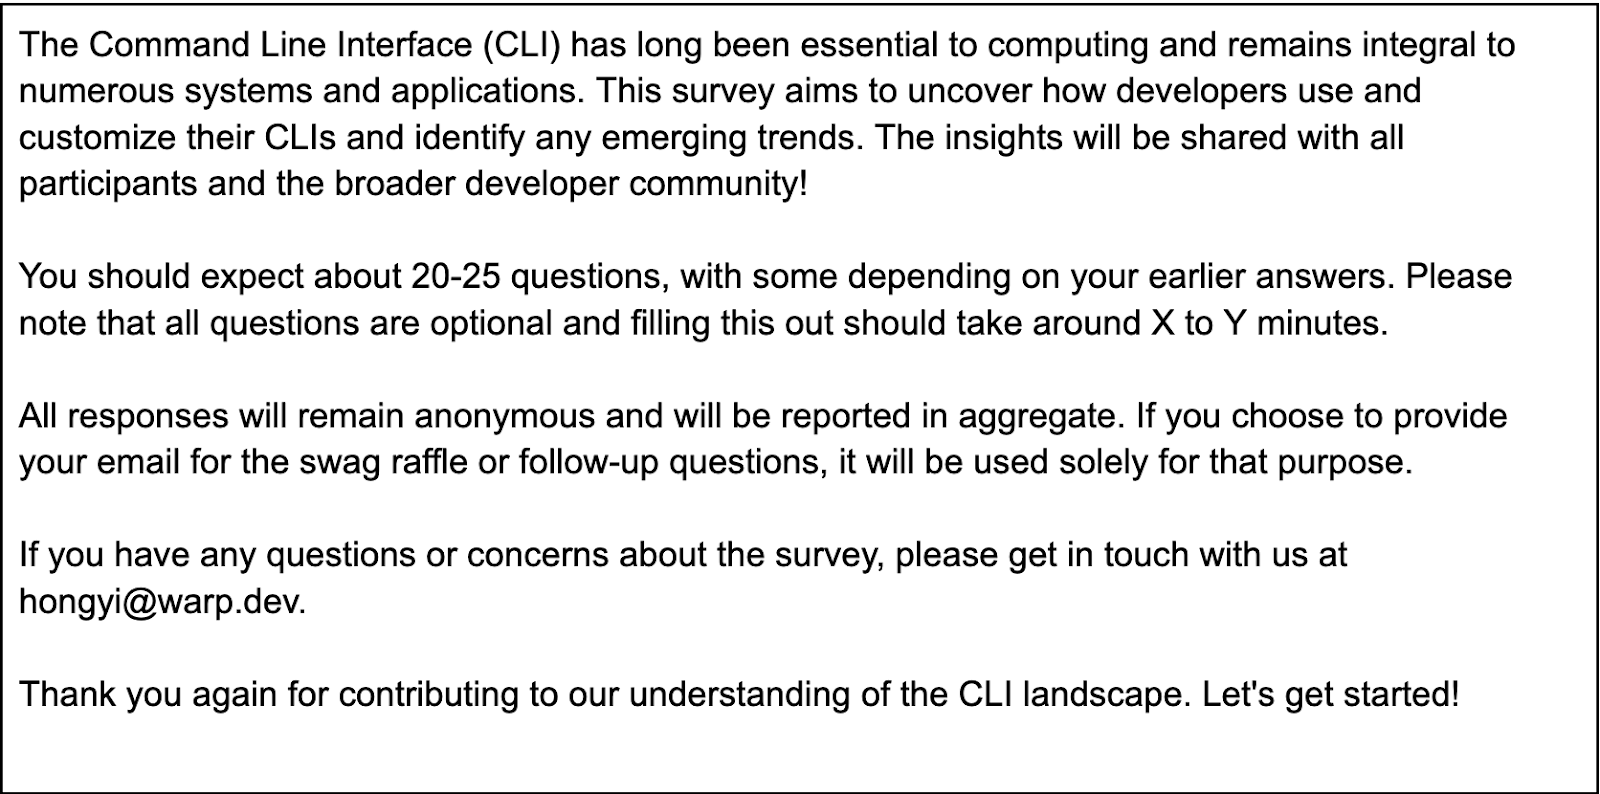
Throughout the survey, we prioritized respondent comfort. Participants were apprised upfront of the survey’s length and anticipated duration, reinforcing that every question was optional. It's important to set expectations right, like prefacing the survey with a realistic completion time.
An overarching theme was the avoidance of presumed prior knowledge. Our target was all developers, irrespective of expertise levels. Ensuring ease of understanding, we provided the necessary context and meticulously scrutinized the language of each question. A case in point is our clarification on the distinction among CLI, shell, and terminal - concepts developers often muddle.
Screening and conditional questions
To ensure each user only encountered relevant questions, thereby reducing the effort needed to complete the survey, we presented questions based on prior responses. This approach allowed the survey to bypass questions irrelevant to the user.
For instance:
- Respondents indicating they don’t use terminals were swiftly directed to the survey's conclusion, focusing on the demographics section.
- The employment status of participants influenced the inclusion of company-specific questions. Only those identifying as full-time, part-time, self-employed, or freelance contractors were posed such questions.
No Forced Questions
In our commitment to creating an authentic and respondent-friendly survey, we embraced the "No Forced Questions" principle. Respondents had the freedom to select which questions to answer, with all of them being optional. Forcing respondents to answer questions they may be uncomfortable with or unsure about can lead to unreliable data. We always favor genuine answers over obligatory responses.
This approach prioritizes participant comfort and serves as a natural feedback mechanism. Questions with higher completion rates naturally stand out as the most effective and relevant. Conversely, a high skip rate for a particular question signals potential design flaws.
Bare Minimum Demographic Information
Demographic information can be a double-edged sword. While invaluable, if probed insensitively, it can discourage participation. We steered clear of excessive or sensitive queries.
Respondents were only asked about their occupation, technical experience, and broader region they were based in. Opting to only ask for regions was much more valuable than asking for individual countries, which could spark political discussions, and give significant statistical noise (i.e. some countries only receiving a few responses).
And when we asked for emails, we did this purely for the swag giveaway (and if they were interested in a longer-form user interview in the future). Once winners were selected, emails were hidden to prevent any bias from reviewing the results.
Question Precision
Crafting the survey was not just about the big picture; we obsessed over the specific wording and format of each question. The structure of the entire survey is important, but fine tuning each question is arguably even more so.
Aware of the vast array of CLI tools available, we anticipated that many respondents would opt for the "other" section. Therefore, we included this option in most of our questions to capture diverse responses. Moreover, we tried to avoid double-barreled questions—those that ask two things at once—marked by words like "and" or "or". We also minimized the use of grids and matrices to avoid confusion.
To ensure relevance, the options on our questions were informed by Google Trends, online forums, and input from team members.
Survey Overview
After a careful process of drafting and editing our survey, our survey went live on June 14th and concluded on July 14th, gathering a total of 1,520 responses.
The survey presented participants with 24 to 28 questions, the exact number varying based on their answers to preceding questions. 80% of the participants completed the entire survey, with an average completion time of 8 minutes and 54 seconds.
For the survey's creation, we chose the SurveyMonkey platform for its usability and reliability relative to other options. This decision proved invaluable, providing us with metrics on completion times, response counts, and dates. It also enabled preliminary filtering and analysis.
Promotion and collecting responses
We didn’t target a specific group; our focus was on reaching a broad spectrum of developers.
To encourage participation, our strategy revolved around two primary objectives: achieving a wide reach and ensuring ease of completion. As an added incentive for meaningful survey completion, we offered 100 Warp hats in a raffle. Our hope was that recipients would showcase these hats on platforms like Twitter. This exposure would not only foster greater interest in the current survey but also stimulate curiosity about Warp, setting the stage for a self-sustaining promotional loop.
During the period in which the survey was open, Warp sent out periodic reminder messages via the various diverse channels:
- Twitter (@warpdotdev)
- Warp email newsletter
- Developer communities on Discord and Slack
- Warp’s network of influencers who helped share amongst their communities
- Computer science student groups
- Word of mouth
A detailed analysis of our outreach revealed that the bulk of our respondents were from Europe (38%) and North America (35%). This distribution wasn't unexpected, given the regions where some of our influential partners shared the survey.
Response Validation
Out of the 1,520 survey responses we initially received, we removed 126 responses based on several criteria:
- Duplicate entries, such as matching email addresses or identical survey content.
- Highly similar submissions, where if two surveys from the same IP address shared more than 80% similarity, we counted them as a single response.
- Contradictory responses, like participants claiming they never use a terminal in one question and then indicating constant terminal usage in another.
- Responses submitted in less than 2 minutes.
After this filtering process, we were left with 1,374 valid responses.
Sharing the Results
While analyzing the data, it wasn't practical to display answers to all 30 questions. Instead, we prioritized showcasing the most relevant insights and those that were particularly surprising or intriguing. Any findings that seemed to be just "common sense" were excluded to maintain focus on the more impactful results.
Sources of Error
Every survey, especially a first attempt, is prone to various errors. As we retroactively examine our approach, we acknowledge a few potential sources of error:
- Warp Bias: A significant portion of our respondents were from the Warp community. This strong representation offers valuable insights into the preferences of Warp users, but it simultaneously introduces a skew. As a result, our findings might not fully encompass the sentiments of the broader terminal and developer communities.
- Sampling Limitations: Our survey sample might not accurately represent the wider developer community, potentially leading to over or under-representation of certain groups. The methods of disseminating this survey could introduce biases, favoring particular subgroups.
- Geographical Underrepresentation: The primary focus of our survey leaned towards Europe and North America, largely due to our audience's reach. This geographical concentration might obscure the nuances of developers' preferences in other regions.
- Platform-Specific Underrepresentation: Despite aiming for inclusivity, we might not have adequately captured the views of Windows and Linux users.
- Self-Selection Bias: Surveys tend to draw participants with strong opinions or those lured by incentives (e.g. our Warp hats). This dynamic can produce data leaning towards enthusiastic perspectives or those participating primarily for rewards.
As we strive for improvement in our future endeavors, we take these observations to heart, ensuring our methodology becomes increasingly robust and our insights even more nuanced.
Conclusion
As we conclude, we want to express our gratitude to every participant who responded. The engagement we observed truly exceeded our expectations. We hope this post distills some best practices to help others undertake impactful developer surveys as well.
Aside from insights for our community, the findings from this survey will help guide our internal research and influence our product direction. We continuously strive to refine our approach in future iterations to provide even more accurate and insightful data.
Since this was our inaugural survey, your feedback holds even greater significance. If you have suggestions or questions, please feel free to reach out at cli-survey@warp.dev.
We'd like to offer special acknowledgements to Laurie for their insights into survey design, and to everyone who helped spread the word about our survey.
Start your software factory
Book a demo and we’ll walk you through the workflows that map to your stack.
Related articles

Jun 18, 2026 · 7 min
We are now factory engineers, not product engineers
This is the memo I shared with the Warp team about what building Warp needs to look like. We will focus less on interactive coding and more own automating software factories, and work with other companies to help them do the same.

Jun 12, 2026 · 5 min
How Rectangle Health Built an AI Teammate That Writes Its Own Code
Rectangle Health used Oz to build a self-improving AI teammate that takes issues from triage through merged PR. The teammate, named Rex, currently ships 35K+ lines of code per week and has written over 50% of it's own code.

Apr 28, 2026 · 4 min
The virtuous loop of open, automated development
With today’s open-sourcing of Warp, our goal is to create a new way of building, where humans and agents collaborate in the open to ship better software, more quickly.