Close the loop with alert monitoring
What we’ll cover
Connect an error monitor webhook to your factory so runtime crashes automatically trigger triage and a fix pull request.
We now have our factory working off our backlog, asking us clarifying questions, and verifying its work. This is pretty fully featured! Still, it's not quite full automation. Could we let the agent monitor the apps it builds to proactively decide what to build next?
In this lesson, we'll close the loop for bug fixes in particular, connecting an error monitoring service to our factory to kick off new tasks.
Whenever an error occurs in the app, it will trigger an alert using a simple error monitor we'll stand up on our machine. This will fire a webhook to start a new factory task so our agents can investigate the stack trace and open a draft pull request with a fix.
Prompt
The error monitor sends a webhook when an alert fires, and an automation starts a task at triage with the crash details.
How it fits together
Our markdown app repository includes a local mock error monitor in apps/error-monitor that you can run on your machine. If you're curious, the same webhook setup works with production monitoring tools like Sentry or Grafana as well.
- Markyerror-reporter
- Monitorgroups into issues
- Webhookbearer token
- Factorytriage stage
Start the local error monitor and trigger a test crash
In your local clone of our markdown app, install dependencies if you haven't already and start the error monitor service:
bash pnpm install pnpm dev:error-monitorThis opens the error monitoring dashboard at
http://localhost:4747and prints a reporting URL (DSN) in the terminal banner.To see how the markdown app reports crashes to the monitor, open a second terminal tab and pass that URL as an environment variable when starting the desktop app:
bash MARKY_ERROR_DSN="<DSN from the monitor banner>" pnpm dev:desktopIn the markdown app window, open the test file under the error monitor test folder (
launch-checklist.md) and click on the highlighted comment thread. Because of malformed timestamp data in the comment thread (RangeError: Invalid time value), the note crashes. If you refresh the error monitor dashboard, you'll see this error appear as a new alert.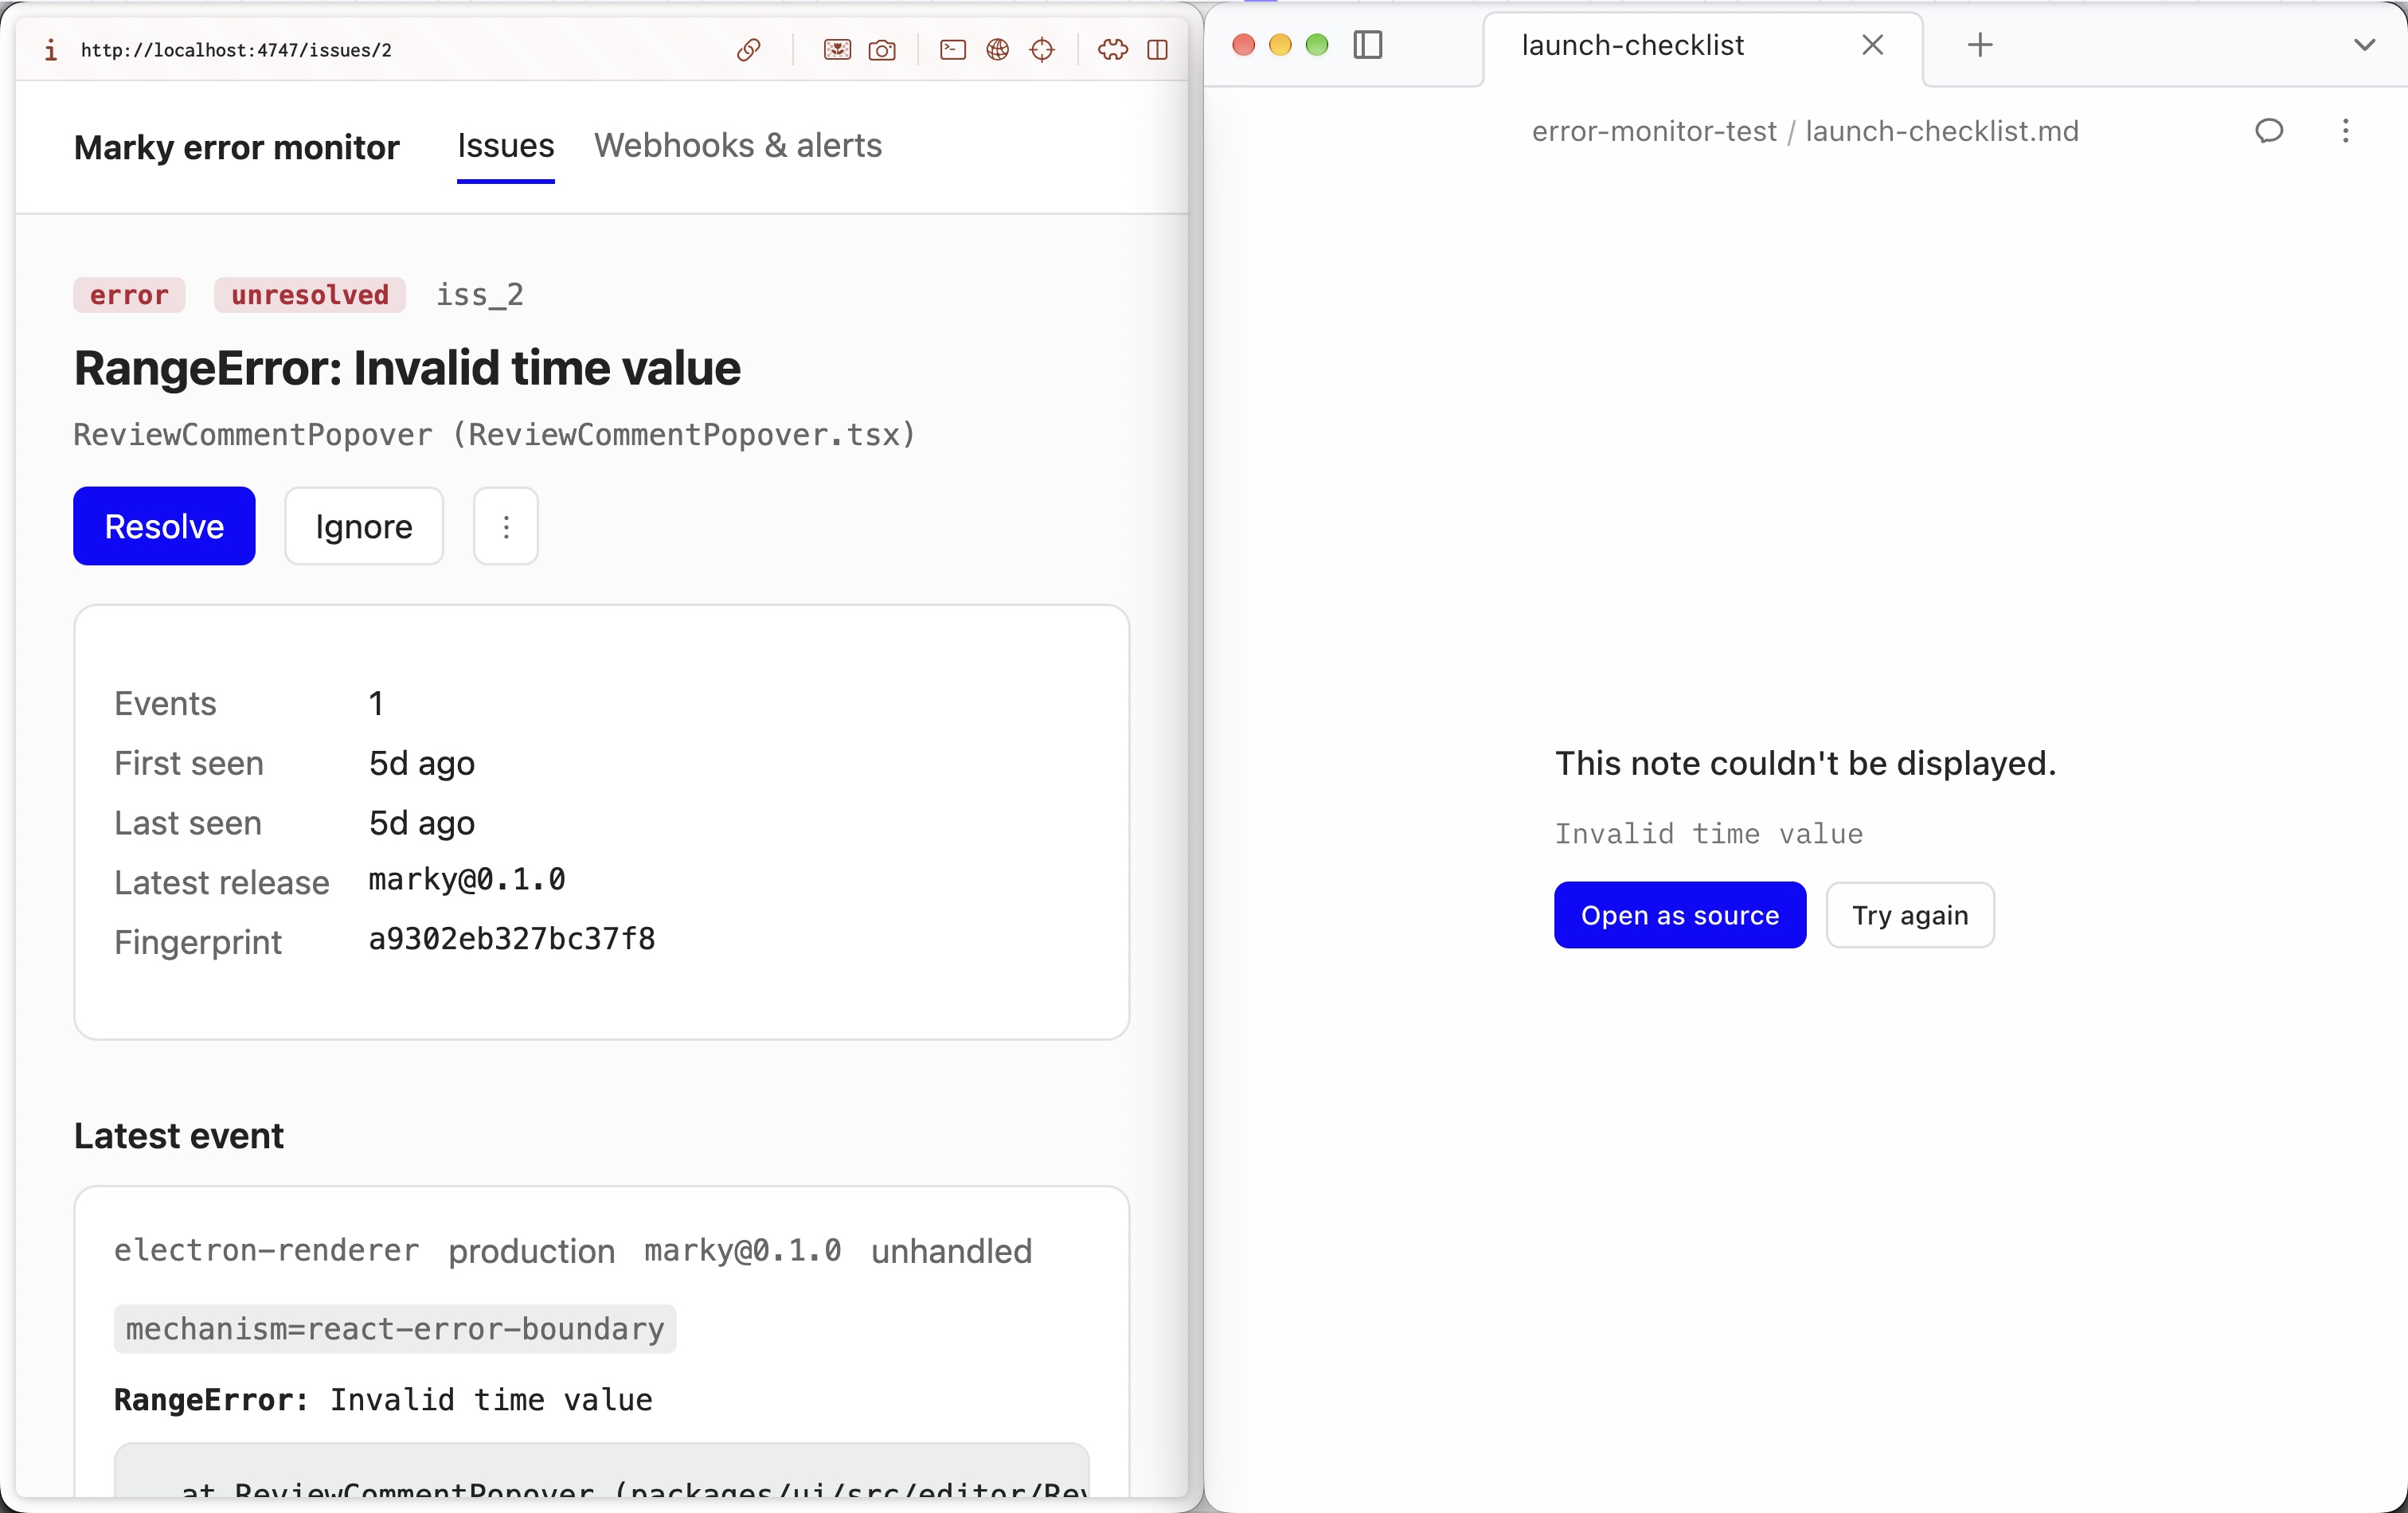
The comment thread crash appears in the error monitor. Add a webhook listener to your factory
Now let's set up a webhook listener on our factory to funnel in those alerts.
In your factory dashboard, head to the Automations tab, click Manage webhooks, and select Add webhook:
- Name:
Error monitor - Authentication type: Bearer token
- Secret name: type
ERROR_MONITOR_WEBHOOK_SECRETor let Warp generate the webhook secret for you - Delivery ID header:
webhook-id
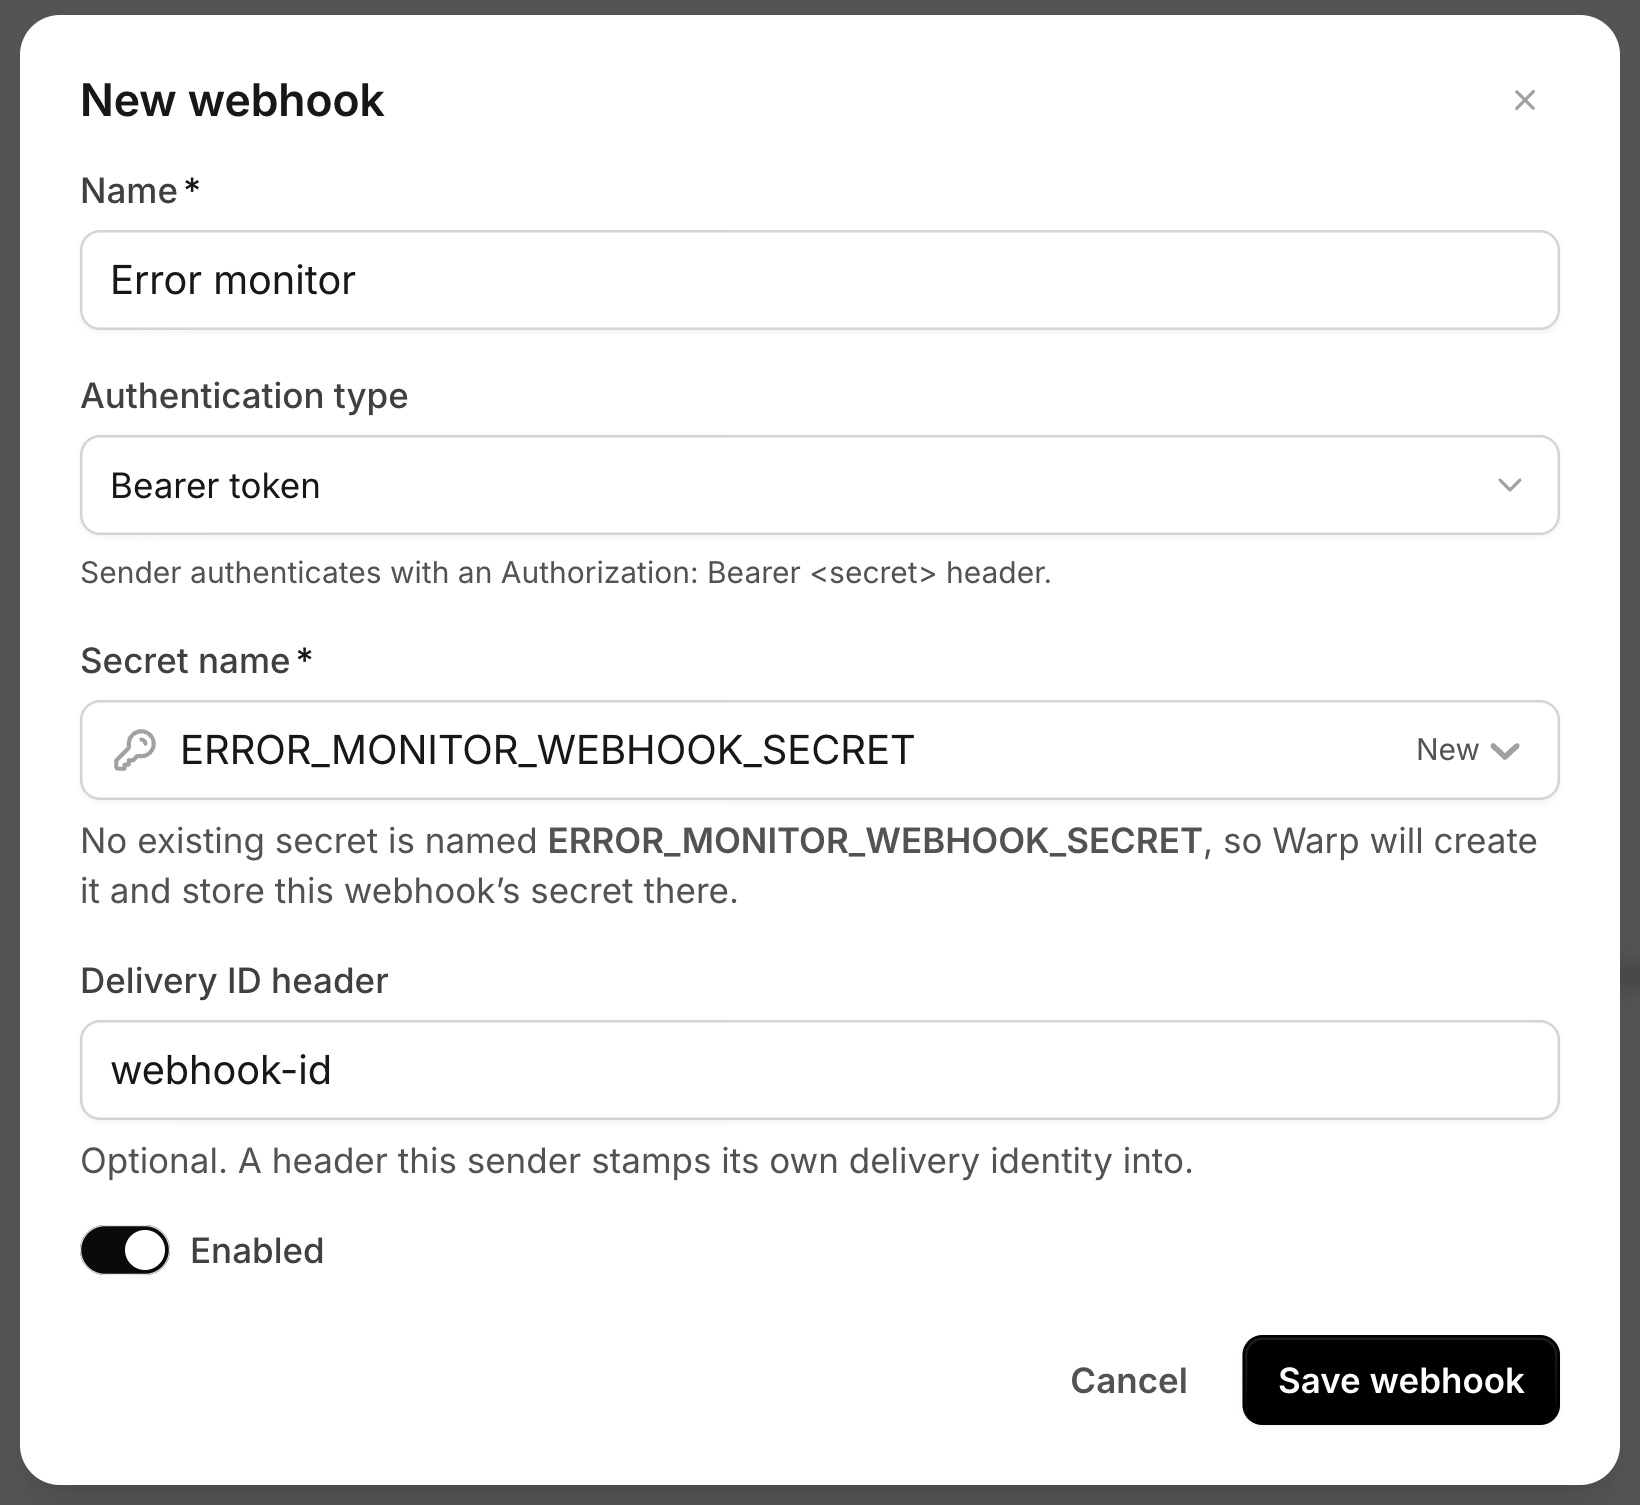
Configure bearer token authentication and set webhook-id as the delivery ID header. Save the webhook, and copy the generated URL and secret from the confirmation screen.
- Name:
Connect the webhook to the error monitor
Head back to the error monitor dashboard and open the Webhooks & Alerts tab at localhost:4747/projects/marky/webhooks. Paste the webhook URL and secret, then click Add endpoint.
To make sure the connection works, click Send test. Back in your factory dashboard under your
Error monitorwebhook, you should see the test request come through.Add the error monitor automation
Now let's attach that webhook to an automation so that incoming alerts start a factory task.
In your factory definition, create
automations/error-monitor/automation.md. Set the trigger provider towebhook, and replaceYOUR_WEBHOOK_UIDwith the ID at the end of the webhook URL you copied earlier:automations/error-monitor/automation.md --- displayName: Triage error monitor alert triggers: - provider: webhook event: received filter: webhook_ids: [YOUR_WEBHOOK_UID] payload: type: [issue.created, issue.regressed, issue.threshold] --- An error monitor alert for Marky triggered this run. The payload is the alert: `type`, `issue` (title, culprit, count, release), and `event` (exception, stack frames innermost first, breadcrumbs, tags). `issue.url` points at the monitor on someone's laptop, so you cannot open it. Treat the alert as a bug report and enter triage with it. Find the code in the top in-app stack frame and reproduce the failure with a failing test. If the input that triggered it is bad data, the app should degrade gracefully instead of crashing. The pull request description must include `Fixes <issue.id>` and the alert type, so the fix can be matched to the monitor issue.Trigger the crash and watch the factory fix it
Let's trigger the crash fresh to watch the full loop in action. In the error monitor dashboard, delete the issue from earlier so it fires as a brand-new alert, then head back to the running app and click the broken comment thread again.
Now open the Runs tab in your factory. If you clear the My Runs filter, you'll see an external webhook run kick off automatically. Clicking into the builder worker, you can watch it trace the root cause from the stack trace, write a regression test for the malformed timestamp, and open a draft pull request with the fix.
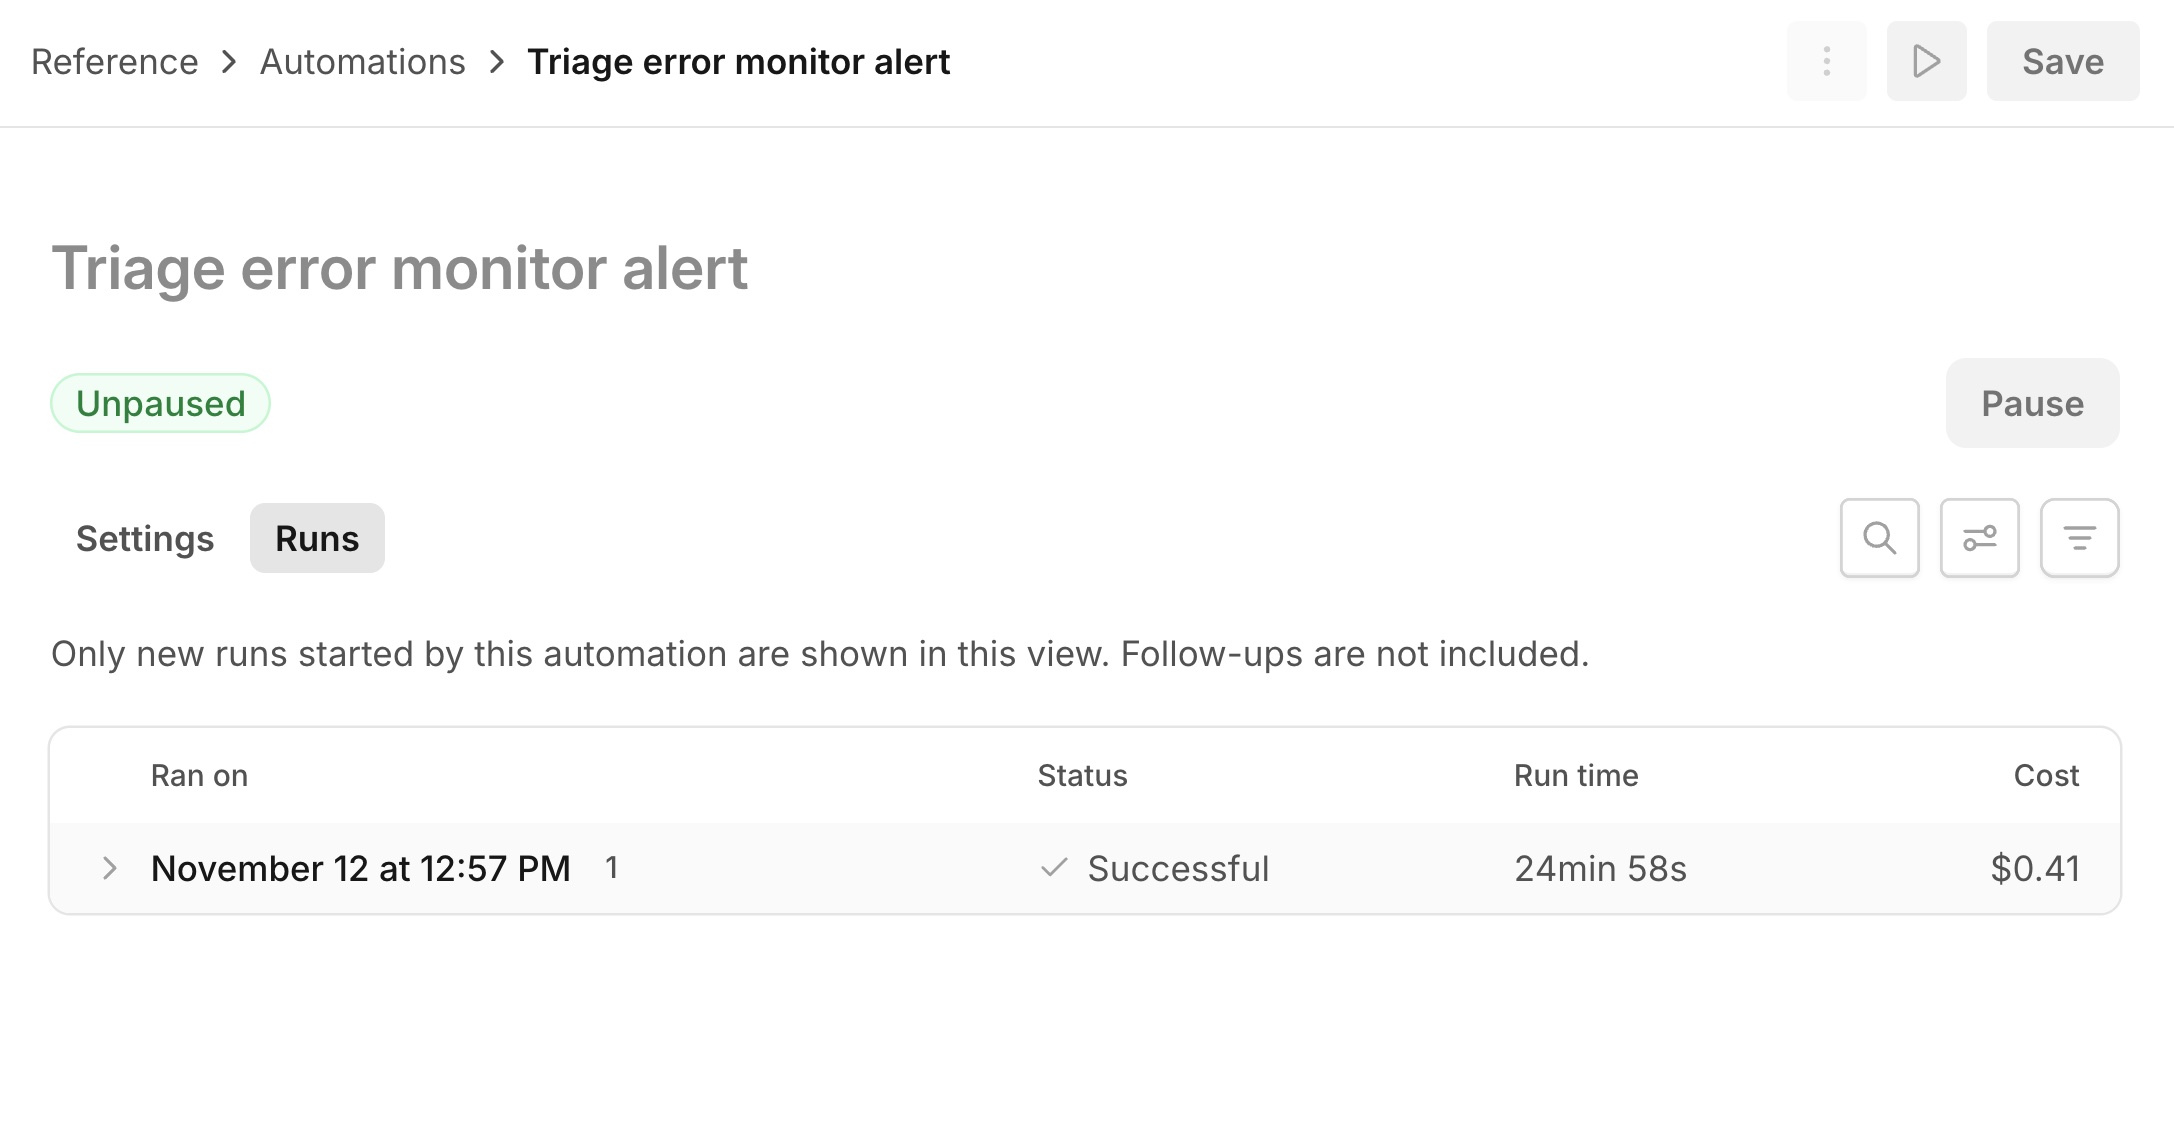
An error in your running app, turned into a pull request automatically. If you're used to error monitors pinging a noisy Slack channel while an on-call engineer copy-pastes stack traces into a local agent prompt, this should be a real improvement.
Where to go from here
From here, there's plenty more you can layer onto your inner factory loop:
- Auto-tagging code owners and risk labels: Combine error alerts with a
CODEOWNERSfile so the right engineer gets tagged as soon as a fix PR opens, or have themerge-riskskill apply risk labels (low,medium,high) to issues so you know which ones deserve your attention first. - Cloud runners for heavier platforms: You can point factories at mobile apps too. For example, you can run iOS builds and computer-use recordings on a macOS runner in the cloud so engineers and designers can review changes without needing Xcode installed locally.
- Collaborating in Slack or Microsoft Teams: Connect the Slack or Teams integration to bring spec questions, status updates, and inline computer-use recordings directly into the channels where your team already works.
Because your factory has full access to its own configuration files, adding these new integrations, skills, or automations is as simple as asking for them in factory chat.
- factory.yaml
- workers/foreman/worker.md
- workers/builder/worker.md
- automations/github-issues/automation.md
- stages/triage.md
- stages/spec.md
- stages/implement.md
- skills/ui-verification/SKILL.md
- skills/merge-risk/SKILL.md
- automations/error-monitor/automation.mdnew
Now that you have a complete inner factory loop running, it's time to look at how we measure and improve that factory over time. In Unit 3, we'll explore the factory dashboard to track average cost per PR and cycle time, and set up scorers, self-improvement, and benchmarks so our factory gets better with every run.